
Business
OSB Share Price: What It Is and What Moves It


If you’ve searched for the OSB share price, you’re probably looking at OSB Group plc, the London-listed specialist mortgage lender and savings bank that trades under the ticker OSB on the London Stock Exchange. Maybe you already hold the shares, maybe you’re weighing whether to buy in, or maybe you just saw the ticker mentioned somewhere and want to understand what you’re looking at.
Whatever brought you here, this guide walks through the current price picture, the factors that push it up or down, how to interpret the numbers you’ll see on a broker app or finance site, and the common questions people have about this stock.
Direct Answer: What Is the OSB Share Price?
OSB Group plc (LSE: OSB) shares have recently traded in a range of roughly 535p to 565p, with a market capitalization near £1.9 to £2.0 billion. The stock’s 52-week range spans from about 344p to 575p, reflecting a strong recovery over the past year. Because share prices change constantly during trading hours, treat any figure you read, including this one, as a snapshot rather than a live quote. Check a real-time source such as the London Stock Exchange website or your broker for the exact current price.
Quick Facts About OSB Group Stock
- Ticker symbol: OSB (sometimes written as LON:OSB or OSBO)
- Exchange: London Stock Exchange
- Index membership: FTSE 250
- Sector: Financial services, specialist mortgage lending and retail savings
- Currency: Shares are quoted in pence (GBX), not pounds
- ISIN: GB00BLDRH360
Who Is OSB Group Plc?
OSB Group is a UK specialist bank built around two older businesses that merged in 2019. One side of the family tree is OneSavings Bank, which traces back to Kent Reliance, a building society founded in 1898. OneSavings Bank floated on the London Stock Exchange at 170p and later entered the FTSE 250. The other side is Charter Court Financial Services, a specialist lender founded in 2008 that floated at 230p and also joined the FTSE 250.
OneSavings Bank agreed to acquire Charter Court Financial Services for roughly £730 million in March 2019, and the deal completed on 4 October 2019. The combined business was renamed OSB Group, which became the holding company for both banking brands.
Today, OSB Group operates through several subsidiary brands, including Kent Reliance, Charter Savings Bank, Precise Mortgages, and InterBay. The group’s core business is specialist mortgage lending, particularly buy-to-let and commercial property finance, funded largely through retail savings accounts. This is a narrower, more specialized model than a typical high-street bank, which is worth keeping in mind when comparing OSB’s numbers to a bank like Lloyds or Barclays.
What Drives the OSB Share Price?
A bank’s share price rarely moves for just one reason. For OSB Group, the following factors tend to matter most.
Interest Rates and the Bank of England
OSB makes most of its money from the gap between what it pays savers and what it charges borrowers on mortgages, known as the net interest margin. When the Bank of England changes its base rate, that margin can widen or narrow depending on how quickly OSB’s savings and lending books reprice. Rate decisions and expectations about future moves are one of the biggest swing factors for any UK specialist bank’s valuation.
The UK Buy-to-Let and Mortgage Market
Because a large share of OSB’s loan book sits in buy-to-let and specialist residential mortgages, the health of that market feeds directly into earnings. Landlord demand, property prices, tax rules affecting landlords, and mortgage arrears all show up eventually in OSB’s results and, in turn, its share price.
Capital Ratios and Regulatory Guidance
Banks operate under capital requirements set by regulators, and any change to a bank’s own capital targets tends to move the stock. When a bank lowers its target capital ratio, it can free up cash for dividends or buybacks, which investors often view positively, though it can also signal a shift in risk appetite that some investors want to understand before reacting.
Earnings Reports and Guidance
Like any listed company, OSB releases half-year and full-year results, along with trading updates. Net interest income, loan impairments, cost growth, and forward guidance on margins all get scrutinized by analysts and can move the price sharply on the day of release.
Leadership Changes
Changes at the top of a bank tend to draw investor attention because leadership shapes strategy on lending appetite, cost control, and capital allocation. A confirmed change in chief executive is the kind of announcement that often triggers short-term share price movement while the market assesses what continuity or change it might bring.
Broader Market and Sector Sentiment
OSB doesn’t trade in isolation. Sentiment toward UK banks as a sector, worries about a recession, housing market wobbles, or a re-rating of financial stocks generally can move OSB’s price even when nothing company-specific has changed.
How to Read OSB’s Key Numbers
If you’re looking at OSB on a finance site, you’ll typically see several figures alongside the price. Here’s what they mean.
Market capitalization is the share price multiplied by the total number of shares outstanding. It tells you the total value the market currently places on the company, roughly £1.9 to £2.0 billion for OSB at recent prices.
P/E ratio (price-to-earnings) compares the share price to the company’s earnings per share. A useful sanity check: OSB’s P/E has appeared very differently across different data providers and time periods, sometimes in the single digits and sometimes far higher. This kind of swing usually happens when reported earnings include one-off items, such as provisions or valuation adjustments, that temporarily shrink or inflate the earnings figure used in the calculation. When you see a P/E that looks unusually high or low for a bank, it’s worth checking whether recent earnings included anything unusual before drawing conclusions.
Dividend yield shows the annual dividend as a percentage of the share price. OSB has historically paid a dividend as part of its capital return policy, though the exact yield shifts with both the dividend amount the board declares and the share price itself. Always check the ex-dividend date and the board’s most recent dividend announcement rather than relying on a yield figure that may reflect a temporary gap between payments.
52-week range shows the highest and lowest prices over the past year, useful for judging where the current price sits relative to its recent history.
Analyst price target is the average of forecasts from equity analysts covering the stock. It reflects opinion, not certainty, and tends to be based on a small number of analysts for a mid-cap stock like OSB, so treat it as one input rather than a prediction.
Step-by-Step: How to Check the Current OSB Share Price
- Go to a real-time source, such as the London Stock Exchange’s own site, your brokerage platform, or a financial data provider.
- Search for the ticker “OSB” and confirm the exchange shown is London (LSE), since other exchanges list unrelated companies with similar tickers.
- Note that the price will be quoted in pence (GBX), not pounds. A price of “555” means 555 pence, or £5.55 per share.
- Check the timestamp on the quote. Prices during UK market hours (roughly 8:00 a.m. to 4:30 p.m. UK time on weekdays) update continuously; outside those hours you’re seeing the last closing price.
- Look at the day’s range and the 52-week range for context on where the current price sits.
- If you’re comparing valuation, check the P/E ratio and dividend yield against OSB’s own history and against similar UK specialist banks, rather than against unrelated sectors.
Common Mistakes People Make
Confusing pence and pounds. A quoted price of 555 is 555 pence, not £555. This trips up a lot of newer investors looking at UK stocks for the first time.
Assuming a snapshot price is live. Screenshots, cached pages, and some finance apps can lag behind the actual market by minutes or longer. Always check the timestamp.
Reading P/E in isolation. As noted above, a bank’s P/E can look extreme in either direction because of one-off accounting items. Compare it across a few quarters rather than trusting a single number.
Treating the analyst price target as a guarantee. A price target is a forecast built on assumptions that can change. It is not a promise of where the stock will trade.
Ignoring sector context. OSB’s price often moves in sympathy with UK banks generally, especially around Bank of England rate decisions. A move in OSB’s price isn’t always about OSB specifically.
A Realistic Example
Imagine an investor checking OSB’s share price ahead of a scheduled trading update. In the days before the release, the price might drift within a narrow range as the market waits for new information. If the update includes stronger-than-expected net interest income and reassurance on loan arrears, the share price could jump within the trading session as analysts revise their models. Conversely, if the update flags rising arrears in the buy-to-let book or lowers earnings guidance, the price could fall sharply even if the wider market is flat that day. This is why checking both the company-specific news and the broader banking sector backdrop gives a fuller picture than the price alone.
Key Facts
- OSB Group trades on the London Stock Exchange under the ticker OSB and sits in the FTSE 250 index.
- The company was formed through the combination of OneSavings Bank and Charter Court Financial Services, announced in October 2019.
- The merger was completed on 4 October 2019,creating OSB Group as the holding company.
- Shares are quoted in pence (GBX); recent trading has ranged roughly between 535p and 565p, within a 52-week range of about 344p to 575p.
- Market capitalization has recently sat around £1.9 to £2.0 billion.
- The company’s core business is specialist mortgage lending, especially buy-to-let and commercial finance, funded by retail savings brands including Kent Reliance and Charter Savings Bank.
FAQ
What is the OSB share price right now?
It changes throughout each trading day. Recent trading has clustered in the 535p to 565p range, but you should check a live source for the exact current figure since this guide can’t update in real time.
How does the OSB share price work?
OSB shares trade on the London Stock Exchange in pence per share. The price reflects what buyers and sellers are currently willing to pay, which shifts based on company earnings, interest rate expectations, sector sentiment, and broader market conditions.
Why is the OSB share price important to watch?
For shareholders, it determines the value of their holding and, alongside the dividend, their total return. For prospective buyers, it’s a starting point for judging whether the stock looks cheap or expensive relative to its earnings and historical range.
Is OSB Group a safe stock to buy?
No individual stock is risk-free, and specialist mortgage lenders can be more sensitive to interest rate and housing market swings than diversified high-street banks. Whether OSB fits your portfolio depends on your own risk tolerance and goals, and this article isn’t financial advice. It’s worth researching the company’s own results and consulting a qualified financial adviser before making investment decisions.
Is it legal for UK residents to buy OSB shares?
Yes. OSB Group is a publicly listed company on the London Stock Exchange, and its shares can be bought through any UK-regulated stockbroker or investment platform, often within an ISA or general investment account.
What are the alternatives to OSB Group shares?
Investors comparing UK specialist mortgage lenders sometimes look at other FTSE-listed banks and building societies with similar buy-to-let or specialist lending exposure. Each has a different risk profile, loan book composition, and capital position, so direct comparisons should go beyond the share price alone.
What should I know before checking or trading OSB shares?
Remember prices are in pence, confirm you’re looking at the London-listed OSB and not a similarly named ticker elsewhere, and look at both the current price and recent trading history rather than a single number in isolation.
Key Takeaways
- OSB Group plc trades on the London Stock Exchange as OSB, within the FTSE 250.
- The company formed in 2019 from the merger of OneSavings Bank and Charter Court Financial Services.
- Its share price is shaped by UK interest rates, the buy-to-let mortgage market, capital ratio decisions, earnings updates, and leadership changes.
- Share prices are quoted in pence, and figures found online are snapshots, not live prices.
- Metrics like P/E ratio and dividend yield need context, since one-off items can distort them for a given period.
Conclusion
The OSB share price reflects a specialist UK bank built from two long-established lenders, shaped day to day by interest rate moves, mortgage market conditions, and company-specific news. Understanding the story behind the number, rather than just the number itself, gives a clearer picture of why the price sits where it does and what tends to move it next. For the most accurate, up-to-the-minute figure, always check a live market data source before making any decisions.
Introduction
People searching for neworldsmagazine may be trying to identify a website, understand what kind of publication it is, or determine whether it is connected to the well-known historical science-fiction magazine New Worlds. The name can create confusion because there are two different things that may appear in search results.
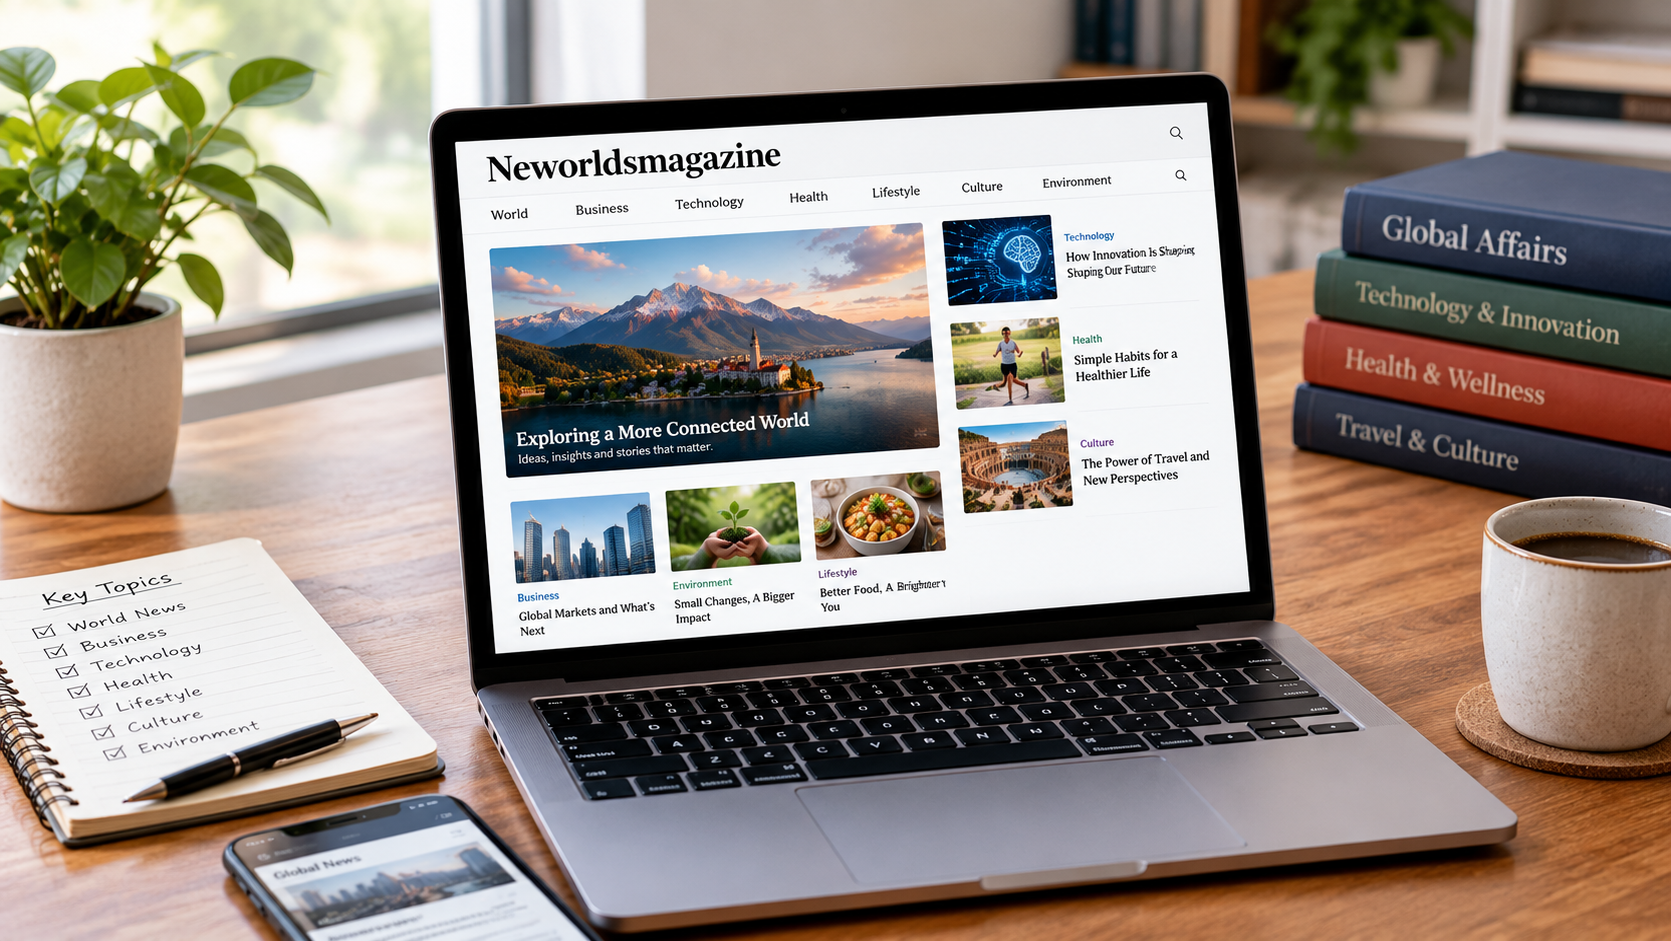
The current website at newworldsmagazine.com presents itself as New Worlds Magazine, an online publication focused on science, technology, culture, society, environmental issues, sustainability, innovation, and business. Its stated mission centers on exploration, discovery, education, and curiosity.
That is different from New Worlds, the influential British science-fiction magazine that began as a fanzine in the 1930s and became a professional publication in 1946. The historical magazine played an important role in the development of experimental and New Wave science fiction.
Understanding that distinction is the first step when researching neworldsmagazine.
Direct Answer: What Is Neworldsmagazine?
Neworldsmagazine generally refers to New Worlds Magazine, an online publication available at newworldsmagazine.com. The website describes itself as a publication covering science and technology, culture and society, environmental sustainability, innovation, and business. Its homepage also currently contains practical and general-interest articles covering subjects such as travel, printing, engineering, marketing, technology, and other topics.
It should not automatically be confused with the historic British science-fiction publication New Worlds, which has a separate publishing history dating back to the 1930s.
What Is New Worlds Magazine?
New Worlds Magazine is the name used by the current website associated with newworldsmagazine.com.
According to its About Us page, the publication aims to explore subjects involving science, technology, culture, the environment, and innovation. It presents its editorial mission around curiosity, discovery, education, and new perspectives.
The site’s stated coverage includes four broad areas:
- Science and technology
- Culture and society
- Environment and sustainability
- Innovation and business
The site says its intended audience includes curious general readers, professionals interested in current developments, and people who enjoy informative stories.
However, the actual articles visible on the homepage suggest that the site’s publishing scope is broader than those four categories.
For example, recent homepage entries include an article about hidden locations near Joshua Tree, a discussion of anonymous poker sites, a guide to paper stock, an explanation of duplex pump systems, and an article comparing CMYK and RGB color systems.
This means readers should look at the individual article and its sources rather than assuming every article represents the same specialist subject area.
What Topics Does Neworldsmagazine Cover?
The publication’s stated editorial categories provide a useful starting point, but its actual content appears more diverse.
Science and Technology
Science and technology are central to the site’s stated mission. The About Us page specifically mentions subjects such as quantum computing and space exploration as examples of the type of material it wants to cover.
This category can include explanations of emerging technologies, scientific developments, technological trends, and discoveries.
For readers, the most useful approach is to evaluate individual science articles based on whether they provide identifiable sources, accurate terminology, appropriate context, and clear distinctions between established findings and speculation.
Culture and Society
New Worlds Magazine also says it covers culture, society, social movements, and the arts.
This gives the publication room to discuss human behavior, cultural developments, creative work, social issues, and changes in communities.
Because these subjects can involve interpretation as well as factual reporting, readers should distinguish between verifiable facts and editorial viewpoints.
Environment and Sustainability
Environmental issues and sustainability are another stated area of coverage.
The publication says it addresses environmental problems, sustainable practices, natural systems, and climate-related issues.
For technical environmental claims, the quality of an article depends heavily on evidence. Scientific papers, government agencies, universities, and established research organizations are generally stronger sources for specific scientific claims than unsourced statements.
Innovation and Business
The site also identifies innovation and business as areas of interest.
This can include companies, technological innovation, business developments, entrepreneurship, and industries undergoing change.
Readers should be particularly careful with business-related articles because company claims, market forecasts, product descriptions, and performance statements can become outdated quickly.
What Kind of Articles Appear on Neworldsmagazine?
The current homepage provides an important clue about the site’s actual publishing model.
Among its listed articles are:
- A local-travel article about hidden destinations near Joshua Tree
- An article discussing anonymous poker site features
- A guide to selecting paper stock for printing
- An explanation of duplex pump systems
- An article explaining CMYK versus RGB
- A print-marketing article
- A guide to archiving print files
- Articles about automotive repair
- An article about ABA therapy in California
- A technology trends article
This is a much broader collection than a conventional specialist magazine focused only on science or science fiction.
Therefore, describing neworldsmagazine simply as a “science magazine” would be incomplete. The current website functions more like a broad online publication with multiple informational subjects.
Is Neworldsmagazine the Same as the Historic New Worlds Magazine?
No. This is one of the most important distinctions to understand.
The historic New Worlds was a British science-fiction magazine with roots in the 1930s. It began as a fanzine called Novae Terrae and adopted the name New Worlds in 1939. It became a professional publication in 1946 under editor John Carnell.
The historic magazine became particularly influential during the 1960s when Michael Moorcock edited it. It became closely associated with the British New Wave science-fiction movement and published experimental work by important writers.
The current newworldsmagazine.com website, by contrast, describes itself as a modern online publication covering a wide range of subjects.
The similar wording of the names should therefore not be treated as evidence that the two publications are connected.
A Simple Comparison
| Feature | Newworldsmagazine.com | Historic New Worlds |
| Type | Modern online publication | British science-fiction magazine |
| Main identity | New Worlds Magazine | New Worlds |
| Website | newworldsmagazine.com | Historical publication with a separate history |
| Stated subjects | Science, technology, culture, environment, business and more | Science fiction and experimental literature |
| Origins | Modern website | Began as a fanzine in the 1930s |
| Professional publication | Modern digital publication | Professional magazine from 1946 |
| Major historical figure | Current site’s public pages do not establish a comparable historical editorial legacy | John Carnell and later Michael Moorcock |
| New Wave connection | Not established | Strong historical connection |
The historical publication’s publishing record is documented by specialist bibliographic resources such as ISFDB and historical research sources.
How Does Neworldsmagazine Work?
From a reader’s perspective, newworldsmagazine.com operates as a conventional online content publication.
The homepage presents featured and recent articles, with each article accessible through its own page. The site also provides an About Us section describing its editorial mission and a Contact page for inquiries, editorial matters, advertising, subscriptions, and customer support.
The site also has a privacy policy describing the collection of information such as names, email addresses, phone numbers, mailing addresses, IP addresses, browser information, and browsing activity when users interact with the website.
For a normal reader, the basic process is simple:
- Visit the website.
- Browse the available articles.
- Select a subject that interests you.
- Read the article and examine its supporting information.
- Check external sources when the article makes important technical, scientific, medical, financial, or legal claims.
- Use the site’s contact information if you need to contact the publication.
The important point is that reading an article and independently verifying an important claim are two different activities.
Is Neworldsmagazine a Reliable Source?
There is no single yes-or-no answer that applies equally to every article.
The website states that it is committed to journalistic integrity and says its team includes journalists, researchers, and editors who aim to provide accurate, well-researched, and unbiased material.
Those are useful statements about the publication’s stated standards, but they should not replace normal source evaluation.
A reader assessing an article should consider:
- Who wrote the article?
- Is an author identified?
- Does the article cite primary or authoritative sources?
- Are important claims supported by evidence?
- Is the information current?
- Does the article distinguish facts from opinions?
- Does the topic require specialist expertise?
- Can important claims be independently confirmed?
This is particularly important because the site’s current content spans many unrelated fields. An article about printing technology, for example, requires different expertise from an article about environmental science or engineering.
A Practical Reliability Test
Suppose you find a newworldsmagazine article making a technical claim about a pump system.
A sensible reader would not rely solely on the article. Instead, they could compare the explanation with manufacturer documentation, engineering references, standards, or other reputable technical sources.
The same principle applies to science, medicine, finance, law, and other high-stakes subjects.
This approach does not mean the website’s articles are automatically unreliable. It means that source quality should be evaluated at the article level, especially when the consequences of an incorrect claim are significant.
Does Neworldsmagazine Have an About Page?
Yes.
The site’s About Us page describes its mission, vision, coverage areas, editorial goals, and audience. It says New Worlds Magazine aims to explore science, technology, culture, environment, and innovation while encouraging curiosity and lifelong learning.
The page also provides a contact email for inquiries and contributions and identifies social-media channels including Facebook, Twitter, Instagram, and LinkedIn.
An About page can be useful when evaluating an unfamiliar publication because it provides information about the site’s stated purpose. However, it is still only one part of a broader credibility assessment.
Does Neworldsmagazine Provide Contact Information?
Yes. The website has a dedicated Contact page.
That page lists separate contact addresses for general inquiries, editorial matters, advertising, and support. It also displays telephone numbers and a mailing address.
One caution is worth mentioning: the phone numbers shown on the Contact page use the 555 numbering pattern. The page itself presents them as contact numbers, but a reader should not assume from that alone that they represent independently verified business telephone lines.
For important communication, the safest approach is to use the site’s current contact information and verify the identity of the person or organization you are dealing with before sharing sensitive information.
Does Neworldsmagazine Have a Privacy Policy?
Yes.
The website has a published privacy policy that explains information it may collect and how that information may be used.
According to the policy, this can include information voluntarily provided by users as well as technical information collected automatically during website visits. The policy also discusses cookies, service providers, legal requests, business transfers, security measures, user rights, and third-party links.
The policy lists an effective date of June 29, 2024.
Readers should remember that a privacy policy describes a site’s stated practices; it is not, by itself, proof that every technical or organizational practice has been independently audited.
What Should Readers Check Before Trusting an Article?
A simple verification process can prevent many mistakes.
Step 1: Identify the Exact Claim
First, determine what the article is actually claiming.
A general statement such as “this technology is becoming more popular” is different from a specific numerical claim about market size or performance.
Step 2: Look for Sources
Check whether the article provides links to original studies, government information, official documents, company filings, academic research, or other authoritative references.
Step 3: Check the Date
Some information changes quickly.
Technology specifications, business information, laws, prices, travel conditions, and current events can become outdated even when an article remains online.
Step 4: Compare Important Claims
For high-impact information, compare the claim against at least one strong independent source.
Step 5: Separate Facts From Interpretation
An article may contain factual information and editorial interpretation in the same piece.
Knowing which is which makes the content easier to evaluate.
Common Misconceptions About Neworldsmagazine
“Neworldsmagazine is the same as the famous New Worlds science-fiction magazine.”
Not necessarily.
The current newworldsmagazine.com website and the historic British New Worlds magazine have different identities and histories. The historical magazine dates back to the 1930s and became a major science-fiction publication in the mid-20th century.
“New Worlds Magazine only publishes science articles.”
The site’s stated mission includes science, but its current homepage demonstrates a much wider range of subjects, including travel, printing, engineering, marketing, automotive services, and other general-interest topics.
“Having an About page automatically proves that every article is authoritative.”
An About page provides useful information about a publication’s stated mission and standards, but individual articles still need to be assessed for sourcing, accuracy, authorship, and relevance.
“Everything published online is equally current.”
It is not.
The current homepage contains articles published across different dates, including material from 2025 and 2026.
Always check the publication date when information can change over time.
Real-World Example: How to Evaluate a Neworldsmagazine Article
Imagine someone finds an article on newworldsmagazine.com discussing an emerging technology.
The reader should first identify the article’s publication date and author. Next, they should determine whether the article cites research or official technical information.
If the article makes a claim about a scientific discovery, the reader could check the underlying research paper or an authoritative scientific institution.
If the article discusses a company’s performance, official company filings or reputable financial reporting may provide stronger evidence.
If it discusses a technical engineering system, manufacturer specifications, engineering standards, or professional references may be more useful.
This approach turns passive reading into informed research.
Neworldsmagazine and Search Intent
The keyword neworldsmagazine can represent several possible search intents.
Someone searching the term may want to:
- Find the official website
- Understand what the publication is
- Learn what topics it covers
- Determine whether it is connected to the historic New Worlds
- Evaluate its credibility
- Find contact information
- Understand its privacy practices
- Browse its articles
- Determine whether a particular article is trustworthy
That makes the keyword partly navigational and partly informational.
The strongest answer therefore needs to identify the website while also explaining its purpose, content, history, and important distinction from the older science-fiction magazine.
Key Facts About Neworldsmagazine
- Neworldsmagazine commonly refers to New Worlds Magazine and its website, newworldsmagazine.com.
- The site’s stated focus includes science, technology, culture, society, environment, sustainability, innovation, and business.
- Its current homepage contains a broader mixture of practical and informational subjects.
- The website has an About Us page explaining its stated mission and editorial goals.
- It has a dedicated Contact page and Privacy Policy.
- The current website should not automatically be identified with the historic British science-fiction magazine New Worlds.
- The historic New Worlds began as a fanzine in the 1930s and became a professional magazine in 1946.
- The historic publication became strongly associated with the British New Wave science-fiction movement, particularly during Michael Moorcock’s editorship.
Frequently Asked Questions
What is neworldsmagazine?
Neworldsmagazine generally refers to New Worlds Magazine, an online publication at newworldsmagazine.com. The site says it covers science, technology, culture, environment, sustainability, innovation, and business, although its current articles cover a wider range of general-interest subjects.
Is New Worlds Magazine a science-fiction magazine?
The current newworldsmagazine.com site is not presented primarily as a science-fiction magazine. It describes itself as a broad publication covering science, technology, culture, environment, and innovation.
The historic New Worlds, however, was a major British science-fiction magazine.
Is newworldsmagazine.com the same as New Worlds magazine?
The available information does not establish that the current website is the same publication as the historic British New Worlds. Their histories, formats, and stated editorial purposes are different.
What does New Worlds Magazine publish?
Its stated areas include science and technology, culture and society, environmental sustainability, and innovation and business. Its homepage also currently shows articles covering travel, printing, engineering, marketing, automotive services, and other topics.
Does New Worlds Magazine have a contact page?
Yes. The site provides a dedicated Contact page with separate contact information for general inquiries, editorial matters, advertising, and support.
Does the website have a privacy policy?
Yes. Its privacy policy discusses personal information, technical information, cookies, service providers, legal requirements, security, user rights, and third-party links.
Should readers trust every article on Neworldsmagazine automatically?
No website should be treated as automatically authoritative for every subject. Readers should evaluate the author, sources, date, evidence, and claims of individual articles, particularly when the topic involves health, finance, law, science, or other high-stakes information.
Why is the name New Worlds confusing?
The name overlaps with the historic New Worlds, a British science-fiction magazine with a significant literary history. Because the current website uses the name New Worlds Magazine, searches can produce information about both entities.
Key Takeaways
- Neworldsmagazine refers to the modern New Worlds Magazine website and publication.
- The website presents itself as a broad informational publication rather than a narrowly focused specialist journal.
- Its stated coverage includes science, technology, culture, society, environment, sustainability, innovation, and business.
- Current homepage content demonstrates an even broader range of practical and general-interest subjects.
- The website provides About Us, Contact, and Privacy Policy pages.
- Readers should evaluate individual articles based on authorship, evidence, sourcing, publication date, and subject-matter expertise.
- The modern website should not be confused with the historic British New Worlds science-fiction magazine.
- The historic New Worlds has a separate and important literary history dating back to the 1930s.
Conclusion
Neworldsmagazine is best understood as a modern online publication operating under the name New Worlds Magazine. Its own description emphasizes science, technology, culture, environmental issues, sustainability, innovation, and business, while its current homepage shows a broader selection of informational and practical topics.
The most important point for anyone researching the keyword is the distinction between this current website and the historic British New Worlds science-fiction magazine. They should not be treated as the same publication simply because their names are similar.
For readers, the sensible approach is straightforward: use the website to discover information, but evaluate individual claims according to their evidence, sources, date, authorship, and subject matter. That approach provides a more accurate understanding of what New Worlds Magazine is and how its content should be interpreted.
Introduction
When people discover a website called Adstotally.com, they may assume it is an advertising platform, a digital marketing service, or a tool for managing online campaigns. The word “ads” in its name naturally creates that impression. However, a website’s name does not always explain what it actually does.
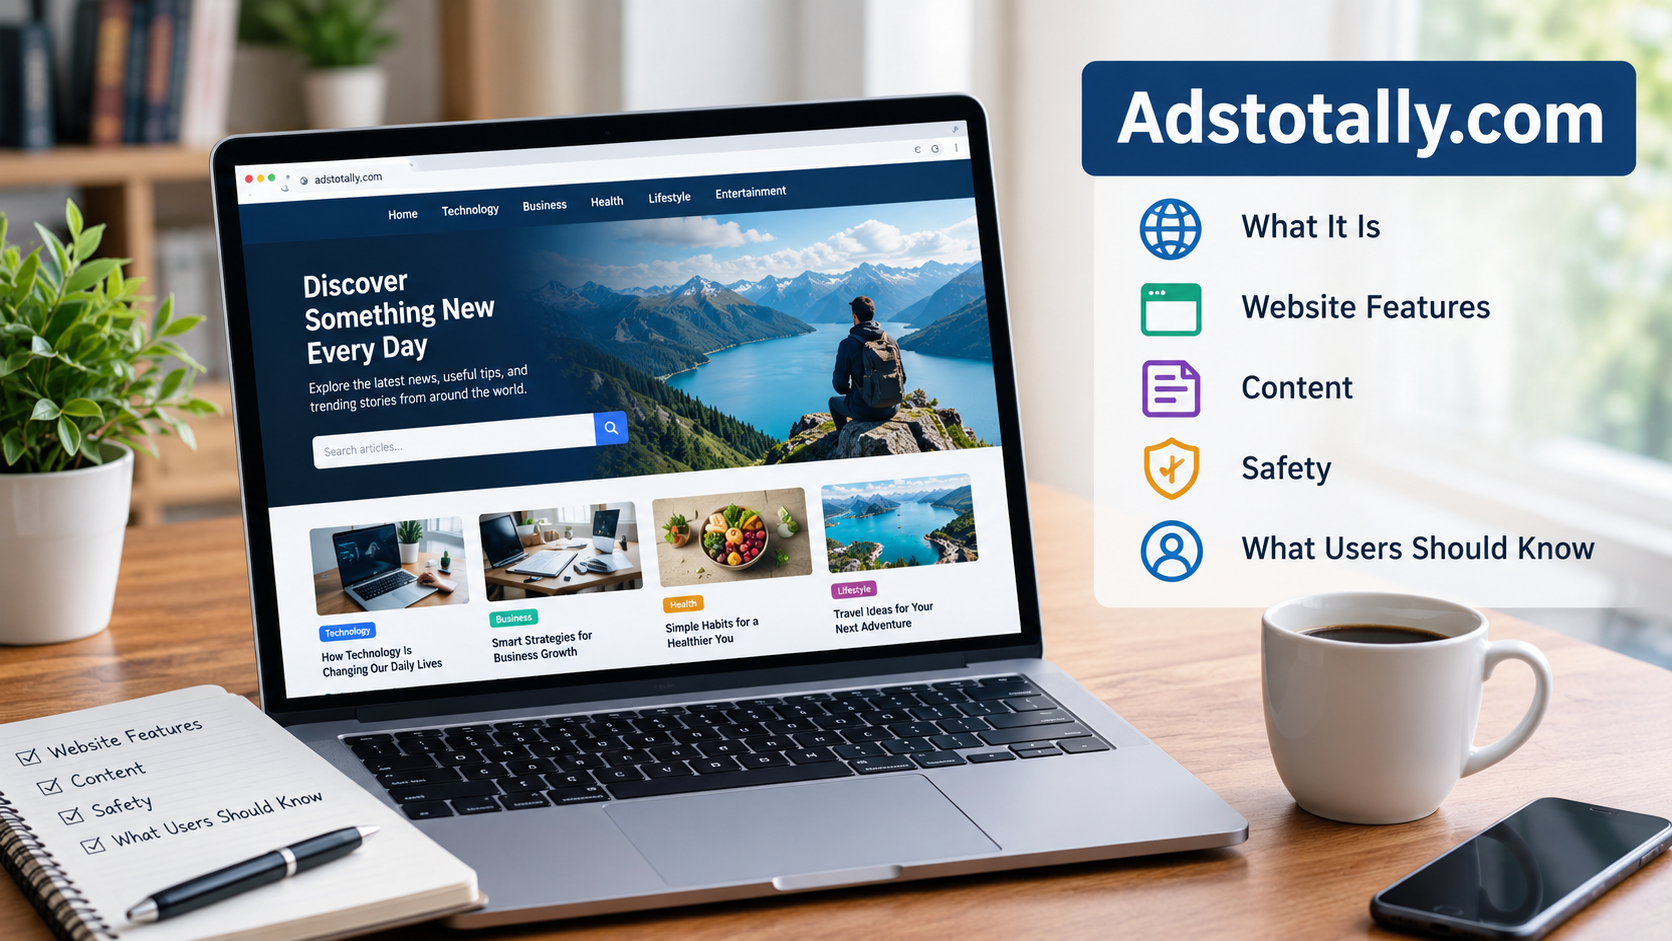
Adstotally.com is associated with a broad online publishing model, with content covering subjects such as technology, business, finance, lifestyle, education, and digital trends. This makes it relevant to readers looking for general information rather than necessarily searching for advertising software.
Understanding the website requires looking beyond its name. Readers may want to know what it publishes, how its content is organized, whether it offers advertising services, and how to evaluate the reliability of its information.
There is also a reason for caution: different websites have described Adstotally.com in different ways. Separating observable features from unverified claims helps readers develop a more accurate understanding of the platform.
Direct Answer: What Is Adstotally.com?
Adstotally.com is a multi-topic website associated with online articles and informational content. Its subject areas include technology, business, finance, lifestyle, education, and digital topics. Despite its advertising-related name, available website information does not establish it as a conventional advertising network or campaign-management platform. Readers can explore its content for general information, while checking important claims against reliable, independent sources.
What Is Adstotally.com Used For?
Adstotally.com is primarily associated with publishing and presenting information across different subject areas. Instead of concentrating on one specialist topic, a multi-niche website brings several categories together under one domain.
This approach can serve readers with different interests. Someone researching technology may find articles about software, while another visitor may be looking for information about personal finance, business, or everyday lifestyle topics.
The website’s purpose is best understood by examining three areas.
1. Providing informational content
A central use of an informational website is to explain subjects that readers want to understand. Articles may introduce unfamiliar concepts, answer common questions, or provide background on a developing topic.
For example, a reader researching digital payments might want to understand how online transactions work. A beginner exploring artificial intelligence may need a simple explanation of how AI tools are used.
A well-written informational article should provide clear definitions, useful context, and enough detail to help readers understand the subject.
2. Covering multiple categories
Multi-topic publications can attract readers with varied interests. Their content may include technology, finance, business, education, lifestyle, and other general-interest subjects.
This broad structure makes it possible to explore different topics without visiting a separate specialist website for each one.
However, broad coverage does not automatically mean that every article offers expert-level guidance. The quality and accuracy of each page still matter.
3. Helping readers discover new subjects
Some visitors arrive with a specific question. Others discover a topic while browsing a website’s categories or related articles.
A general publication can support both types of readers. It may introduce a subject, explain its basic concepts, and provide a starting point for further research.
For complex subjects, however, readers should look beyond introductory articles and consult specialist or primary sources when necessary.
Overview of Adstotally.com
The following table summarizes the website’s general characteristics based on available descriptions.
| Feature | Overview |
| Website name | Adstotally.com |
| General classification | Multi-topic informational publication |
| Main purpose | Publishing articles and general information |
| Subject areas | Technology, business, finance, lifestyle, education, and digital topics |
| Intended audience | General readers and people researching different subjects |
| Advertising software | Not established by the available website descriptions |
| Best use | Exploring information and discovering topics |
| Main consideration | Verify important claims independently |
This overview describes the website’s apparent publishing role. It should not be interpreted as confirmation of every service, feature, or business activity associated with the domain.
Main Content: Understanding Adstotally.com
1. What Topics Does Adstotally.com Cover?
Adstotally.com has been described as a general-interest publication with several content categories. Its broad subject range allows it to address questions from different areas of everyday life.
Technology and software
Articles in this area may discuss artificial intelligence, applications, smartphones, cybersecurity, cloud computing, and digital tools. These subjects help readers understand how technology works and how it affects daily activities.
Finance and money
Financial topics can include budgeting, saving, digital banking, online payments, and basic investment concepts. Readers should verify financial advice before using it to make decisions about their money.
Business and entrepreneurship
Business-related content can help readers learn about entrepreneurship, online businesses, productivity, marketing, and digital transformation.
Education and general knowledge
Educational articles explain concepts, introduce unfamiliar subjects, and help readers build knowledge. Their usefulness depends on the quality of the research and explanations.
Lifestyle and everyday topics
Lifestyle content may cover travel, personal development, home improvement, wellness, career advice, and other practical subjects.
The precise categories and available articles can change over time. Visitors should consult the website’s current navigation to see what it publishes.
2. Is Adstotally.com an Advertising Platform?
This is one of the most important questions about the website.
The domain name suggests a connection with advertising, but the available website descriptions identify Adstotally.com primarily as an informational publication. Its visible content model centers on articles and topic categories rather than a clearly documented advertising-management product.
Adstotally.com
+1
What does a real advertising platform usually offer?
A conventional advertising platform generally provides tools that help advertisers create, manage, or measure advertising campaigns.
Depending on the service, these tools may include:
- Campaign creation and management
- Audience targeting
- Advertising budget controls
- Bidding or pricing options
- Performance reports and analytics
- Billing and payment management
- Advertising inventory or publisher tools
These features are not all required for every advertising service. However, they illustrate the difference between an advertising product and a website that publishes articles about advertising.
What can be confirmed about Adstotally.com?
Available descriptions identify the domain as a content-focused website. They do not establish that it provides a complete advertising dashboard, campaign bidding system, or publisher monetization platform.
Therefore, readers should not assume that they can create campaigns, purchase advertising inventory, or manage advertising revenue through the site.
If you are looking for an advertising service, first confirm that the exact website offers the feature you need. Do not rely on its name or on claims made by unrelated third-party articles.
3. How Does Adstotally.com Work?
As a content website, Adstotally.com can be approached in much the same way as an online magazine or informational blog.
The general process is straightforward.
Step 1: Find a topic
Start with a question or subject you want to understand.
Step 2: Browse the website
Use the available categories or search for a relevant article.
Step 3: Read the information
Review the explanation, examples, and any supporting references.
Step 4: Verify important claims
Check facts against reliable sources before acting on them.
For example, imagine that a small business owner wants to understand search engine optimization (SEO). An article might explain keywords, search intent, backlinks, and organic traffic.
The reader can use that information to understand the basic concepts. Before making major business decisions, however, the reader should also consult reliable documentation and relevant industry sources.
This distinction matters: an informational website can help someone learn about a subject without necessarily providing the tools or professional services needed to act on that knowledge.
4. Key Features of Adstotally.com
The available descriptions point to several characteristics of the website.
Multi-category publishing
The website covers more than one subject. This makes it suitable for readers who want to explore different areas of general knowledge.
The limitation is that broad coverage does not guarantee equal depth across every category.
Article-based information
Its central publishing format is written content. Articles can introduce topics, explain concepts, and provide background information.
Readers should evaluate the content itself rather than assuming that every article has been independently reviewed by a specialist.
Online accessibility
The website can be accessed through a web browser. This makes it possible to read its content without treating it as a dedicated desktop software product.
A website’s accessibility does not, by itself, establish its editorial quality or security.
Educational focus
The site’s own description emphasizes accessible information and explanations across several subject areas.
Adstotally.com
This is a stated editorial goal, not independent proof that every article meets a particular standard.
Changing content
Online publications can add, update, or remove articles. As a result, information about their categories and features should be checked against the current website rather than assumed to remain unchanged.
5. Is Adstotally.com Legit?
The word legit can refer to several different things. A website may be real and accessible without being an authoritative source for every subject it discusses.
It helps to separate three questions.
| Question | What to consider |
| Is the website real? | Can you access the domain and view its pages? |
| Is its content reliable? | Are claims accurate, sourced, current, and written responsibly? |
| Is a service or offer legitimate? | Can you verify the provider, terms, payment process, and promised service? |
Adstotally.com is associated with an active online publication. However, that alone cannot establish the accuracy of all its articles or validate every offer that might use its name.
Check who operates the website
Look for an About page, a contact page, and information identifying the publisher or operating organization.
A clear identity helps readers understand who is responsible for the content. If ownership information is limited, treat that as an unanswered question rather than proof of wrongdoing.
Check the author
An article with a named author and a relevant professional background gives readers more information to evaluate.
For specialist topics, look for evidence that the author understands the subject. A byline alone does not prove expertise.
Check the sources
Reliable articles should support important claims with suitable evidence.
For example, an article discussing a financial regulation should point readers toward relevant official information. A medical article should be consistent with credible medical evidence.
If a page makes a strong claim but provides no way to verify it, do not treat the claim as established fact.
Check publication dates
Some information changes quickly. Software features, financial rules, security guidance, and legal requirements can become outdated.
A recent publication date is useful, but it does not guarantee that the content has been updated correctly.
6. Is Adstotally.com Safe to Visit?
Website safety has two main parts: technical safety and the reliability of the information a website provides.
These should be evaluated separately.
Technical safety
Before interacting with an unfamiliar website, check that the domain is spelled correctly and that the connection uses HTTPS.
HTTPS encrypts information exchanged between your browser and the website. It helps protect the connection, but it does not prove that a website is honest or that its content is accurate.
Be cautious if you encounter:
- Unexpected file downloads
- Pop-ups asking you to install unknown software
- Requests for passwords or payment details without a clear reason
- Suspicious redirects to unrelated domains
- Messages claiming that your device is infected
- Offers that require immediate payment to avoid a supposed problem
These are general precautions for browsing unfamiliar websites, not claims that Adstotally.com necessarily exhibits these behaviors.
Information safety
A website can be technically secure while publishing inaccurate information.
This is especially important for health, finance, legal matters, and cybersecurity. Incorrect advice in these areas can have real consequences.
Use informational articles as a starting point, then check important details with qualified professionals or authoritative sources when appropriate.
Privacy considerations
Before entering personal information, review the website’s privacy policy.
Understand what information is collected, why it is collected, and whether it may be shared with other parties. Avoid providing sensitive information when the purpose of the request is unclear.
Safety assessment: Do not label a website completely safe or unsafe based on its name, domain age, or HTTPS status alone. Evaluate the actual page, the requested action, and the information being provided.
7. Benefits of Using Adstotally.com
A multi-topic publication can be useful in several ways.
Convenient topic discovery
Readers can explore multiple subjects on one website. This can be helpful when researching a broad topic that connects with business, technology, education, or everyday life.
Accessible explanations
General-interest articles often aim to explain concepts in plain language. When done well, this can help beginners understand unfamiliar terminology.
A starting point for research
An introductory article can help readers identify the main questions they need to investigate.
For example, someone researching cloud computing might first learn the difference between public, private, and hybrid cloud services. They can then use that understanding to explore technical documentation or compare providers.
Exposure to related subjects
A multi-niche site may introduce readers to subjects they had not originally planned to research.
This can support general learning, although readers should distinguish interesting introductory content from expert guidance.
8. Limitations of Adstotally.com
The same characteristics that make a multi-topic publication convenient can also create limitations.
Broad coverage may mean uneven depth
A website that covers finance, technology, health, and lifestyle has to address very different fields.
A general article may explain the basics well but lack the detail needed for a specialist decision.
Author expertise may vary
Not every writer will have the same background. Readers should check the author and evidence for articles that involve technical or professional advice.
Content may become outdated
Articles about software, regulations, online services, or market conditions may lose accuracy as circumstances change.
Always check whether a page reflects the current situation.
The domain name may cause confusion
The word “ads” can lead visitors to expect advertising tools. The site’s apparent focus on informational publishing means that users should confirm its actual services before assuming it meets a particular business need.
Publication does not equal endorsement
The presence of an article on a website does not automatically mean that its claims have been independently verified or endorsed by a relevant authority.
9. Adstotally.com for Readers, Businesses, and Marketers
Different visitors may have different reasons for researching the domain.
For general readers
If you want to learn about a new subject, start by identifying the question you need answered.
Read the relevant article, note any claims that matter to your decision, and verify those claims through credible sources.
For general background information, this process may be enough to build a useful foundation.
For students
Students can use general-interest articles to develop an initial understanding of a subject.
However, school and university assignments often require primary sources, academic research, or references from recognized institutions. A general article may help with orientation, but it should not automatically replace those sources.
For business owners
Business owners researching marketing, software, or financial topics should look for information that matches their industry and circumstances.
A general explanation can clarify terminology, but decisions involving budgets, contracts, or business risks require more specific evidence.
For digital marketers and SEO professionals
Marketers may encounter Adstotally.com while researching websites, content publishers, or potential article-placement opportunities.
In this context, the most useful questions are different:
- Does the website publish content relevant to the intended audience?
- Are its articles receiving genuine search visibility?
- Is the relevant category topically appropriate?
- Does the site attract readers who could benefit from the content?
- Are paid placements and link policies clearly disclosed?
- Are the commercial terms transparent?
A website’s name or broad domain-level metrics cannot answer all these questions.
10. Adstotally.com and Guest Posting: What Should Marketers Check?
Guest posting is the practice of publishing an article on another website, often to reach a new audience or share relevant expertise.
Adstotally.com has appeared in third-party guest-post marketplace listings, according to an external website review.
The Bangor Magazine
However, a marketplace listing should not automatically be treated as proof of a current, directly authorized offer.
If you are considering a placement, evaluate the actual opportunity.
Review topical relevance
A relevant article should fit the website’s audience and editorial subject matter.
For example, an article about business software is more likely to fit a business or technology publication than an unrelated piece about a completely different subject.
Topical relevance makes the article more useful to readers.
Examine recent published articles
Review several recent posts rather than relying only on the homepage or a sales page.
Look for original information, clear writing, useful sources, and a consistent editorial purpose.
If the website publishes large numbers of unrelated articles with little evidence of editorial review, investigate further before making a decision.
Evaluate real search visibility
SEO platforms provide estimates of organic traffic, keyword rankings, and backlink metrics. These can help with initial research, but third-party estimates are not the same as verified analytics data.
Where possible, evaluate the specific category and comparable articles. A domain-wide estimate may not reflect the performance of the page where your content would appear.
Understand the link policy
Ask how links are handled, whether commercial relationships are disclosed, and whether the publisher follows applicable search engine policies.
Paid links intended to manipulate search rankings can create risks. Payment for publication should not be confused with a guarantee of ranking improvements.
Confirm the current terms
Before paying for a guest post, confirm:
- The identity of the person or business offering the placement.
- That the offer is authorized by the website.
- The publication fee and any additional charges.
- Whether the article can be edited or removed.
- The expected publication process.
- The link attributes and disclosure policy.
- Whether the content must meet specific editorial requirements.
A placement should be evaluated on its likely value to readers, not simply on a promise of a backlink.
11. How to Evaluate an Article on Adstotally.com
You do not need advanced technical knowledge to assess whether an article deserves your trust.
Use this practical checklist.
Article credibility checklist
0 of 8
The article directly answers the question it claims to address.
The author or publisher is clearly identified.
The publication or update date is visible.
Important claims include credible supporting sources.
Statistics can be traced to their original sources.
The information agrees with reliable independent references.
The article distinguishes facts from opinions.
Any commercial relationships are disclosed where relevant.
Reset checklist
This checklist is a practical evaluation tool, not a formal certification. A page can meet several criteria and still contain errors. The importance of each check also depends on the subject.
For example, a basic lifestyle article may not need the same level of evidence as a page discussing medical treatment or investment risk.
12. Common Mistakes When Researching Adstotally.com
Several misunderstandings can lead to incorrect conclusions about the website.
Mistake 1: Assuming the name describes the service
A domain containing the word “ads” is not necessarily an advertising network.
Better approach: Examine the website’s actual content, navigation, and available tools.
Mistake 2: Treating every online review as factual
Third-party articles may repeat claims from other websites without independently confirming them.
Better approach: Look for direct evidence and distinguish observations from speculation.
Mistake 3: Equating domain age with trustworthiness
An older domain may have changed owners, content, or purpose over time.
Better approach: Evaluate the current website and its recent publishing activity.
Mistake 4: Assuming HTTPS guarantees safety
HTTPS protects the connection but does not verify the publisher’s intentions or the accuracy of its content.
Better approach: Check the domain, links, downloads, and requests for sensitive information.
Mistake 5: Trusting every article equally
A general publication may contain articles of varying quality.
Better approach: Evaluate each page based on its author, sources, date, and subject matter.
Mistake 6: Treating SEO metrics as guaranteed results
Domain Authority, Domain Rating, and estimated traffic are indicators produced by third-party tools. They do not guarantee rankings, visitors, or business outcomes.
Better approach: Combine metrics with topical relevance, page quality, real audience value, and the purpose of the placement.
13. Real-World Examples: When Is Adstotally.com Useful?
The following examples show how someone might approach a multi-topic informational website.
Example 1: A student researching artificial intelligence
A student wants to understand how artificial intelligence is used in education.
An introductory article can explain basic terms and common applications. The student can then check research papers, institutional publications, and relevant education policies for stronger evidence.
The website serves as a starting point rather than the final authority.
Example 2: A small business owner learning about digital marketing
A business owner wants to understand the difference between SEO and paid advertising.
A general article may explain that SEO focuses on visibility in unpaid search results, while paid advertising involves paying for placements. The owner can then consult official platform documentation to learn about specific tools, costs, and requirements.
This approach combines accessible explanations with more detailed evidence.
Example 3: An SEO professional evaluating a publishing opportunity
An SEO professional discovers a marketplace listing associated with Adstotally.com.
Instead of immediately purchasing a placement, they inspect recent articles, assess topical relevance, investigate the publisher, and verify the offer’s terms.
They also consider whether the article would provide value to readers without relying on the backlink as the sole reason for publication.
In each example, the same principle applies: use the website according to what it can actually demonstrate, and verify information when the stakes are higher.
14. Key Facts About Adstotally.com
- Adstotally.com is associated with a multi-topic online publication.
- Its subject areas include technology, business, finance, lifestyle, education, and digital topics.
- The domain name may lead visitors to expect advertising services.
- Available descriptions identify the site primarily with informational publishing, rather than a verified advertising-management product.
- Content quality should be evaluated at the article level.
- HTTPS can protect a web connection, but it does not guarantee that a website or its content is trustworthy.
- Third-party SEO metrics are estimates and should not be treated as guaranteed performance.
- Marketplace listings should be verified before paying for a publication or link-placement service.
- Important health, financial, legal, and security claims should be checked against reliable sources.
Frequently Asked Questions About Adstotally.com
What is Adstotally.com?
Adstotally.com is a multi-topic informational website associated with articles about technology, business, finance, lifestyle, education, and other general-interest subjects.
Is Adstotally.com an advertising network?
Available descriptions identify it primarily as a content publication. They do not establish it as a conventional advertising network with verified campaign-management and ad-serving tools.
What does Adstotally.com publish?
The website is associated with articles covering several subjects, including technology, software, finance, business, productivity, education, and lifestyle. Its current categories may change.
Is Adstotally.com safe?
Its name alone cannot establish whether it is safe. Check the exact domain, use normal browsing precautions, avoid suspicious downloads, and be careful when providing personal or payment information.
Is Adstotally.com a legitimate website?
It is associated with an online publishing presence. However, the legitimacy of a particular service, offer, or article should be evaluated separately. A real website can still publish inaccurate information or feature questionable third-party offers.
Who owns Adstotally.com?
The identity of the owner or operating organization should be confirmed through reliable, current information from the website or other authoritative records. Do not assume ownership based on similar domain names.
When was Adstotally.com created?
A third-party website review reports a domain registration date of October 20, 2018. Domain registration records can provide historical context, but they do not establish when the current publisher began operating the site.
The Bangor Magazine
Does Adstotally.com offer guest posts?
Third-party marketplace listings have associated the domain with article-placement opportunities. Availability, authorization, pricing, and terms should be confirmed directly before making a payment.
Can Adstotally.com help with SEO?
Reading its informational content may help users learn about SEO-related subjects. If you are considering a guest post or backlink, assess the specific page, editorial relevance, link policy, and actual audience value. No ranking improvement should be assumed.
Does Adstotally.com have a mobile app?
The available information does not establish whether it offers an official mobile application. Check the website’s own announcements or verified app-store listings before downloading an app claiming to represent it.
What are the alternatives to Adstotally.com?
The best alternative depends on your goal. For general information, use established publications and reputable educational resources. For technical questions, consult official documentation. For financial, health, or legal decisions, prioritize authoritative sources relevant to the subject.
Should readers trust everything published on Adstotally.com?
No website should be treated as automatically correct. Evaluate the author, date, sources, and evidence for each article. Verify important claims independently, especially when they could affect your health, finances, safety, or legal rights.
Key Takeaways
- Adstotally.com is best understood as a multi-topic informational publication.
- Its name can be misleading if you expect a dedicated advertising platform.
- Its articles may be useful for general learning and topic discovery.
- The quality of information should be assessed on a page-by-page basis.
- Website security, editorial credibility, and business legitimacy are separate questions.
- Readers should verify important claims and exercise caution with downloads, external links, and payment requests.
- Marketers considering guest posts should investigate the publisher, article quality, audience relevance, and current terms before proceeding.
Conclusion
Adstotally.com is associated with a broad online publishing model that covers technology, finance, business, lifestyle, education, and other subjects. Its name may suggest an advertising service, but the available descriptions point primarily toward informational content rather than a verified advertising-management platform.
For general readers, the website can serve as a place to explore topics and develop an initial understanding of unfamiliar subjects. Its usefulness depends on the quality, accuracy, and relevance of the individual articles.
For businesses and marketers, the key is to verify the specific service or publishing opportunity being offered. Domain names, third-party reviews, and SEO metrics are not enough to establish trust or guarantee results.
Ultimately, the most reliable way to assess Adstotally.com is to examine what the website actually provides, review the evidence behind its claims, and use independent sources whenever accuracy matters.

Quick Answer
Nearly three kilometers beneath the surface at Kidd Creek Mine near Timmins, Ontario, geologists discovered water that may have been isolated in rock fractures for roughly two billion years, making it the oldest known water on Earth. The find, led by geochemist Barbara Sherwood Lollar and her team at the University of Toronto, offers scientists a rare window into ancient Earth chemistry and possible clues about how life might survive in similar underground environments on other planets.
Where Was the Water Found?
The water came from Kidd Creek Mine, a base-metal mine near Timmins, Ontario, operated by Glencore. Kidd Creek is widely described as the deepest base-metal mine in the world, with its lowest accessible point sitting roughly three kilometers, or about 9,900 feet, below the surface. That depth makes it one of the few places on land where researchers can directly access rock that old and that deep without drilling.
The mine sits within massive sulfide ore deposits formed in volcanic rock roughly 2.7 billion years ago, when the area was part of an ancient ocean floor. Because that rock has remained geologically undisturbed, not reheated by new volcanic activity and not badly deformed by tectonic movement, it created ideal conditions for water to stay sealed inside rock fractures for enormous stretches of time.
How Old Is the Water, Exactly?
Researchers have found multiple pockets of ancient water at Kidd Creek over the years, each dated using different sampling expeditions:
- In 2013, a team led by Sherwood Lollar reported in the journal Nature that water extracted from about 2.4 kilometers down had a minimum mean residence time of around 1.5 to 1.6 billion years, the oldest water dated at the time.
- Later sampling from an even deeper section, close to three kilometers down, pointed to water that may have been isolated for roughly two billion years, extending the record further.
Because these estimates rely on measuring trapped gases rather than a single definitive marker, scientists describe the ages as minimum residence times rather than exact figures. The Kidd Creek water is currently the oldest that has been dated using this method, though researchers say it’s probably not the oldest ancient water that exists on Earth. Similar isolated pools may be waiting to be found in deep rock elsewhere.
How Do Scientists Know the Water Is So Old?
Dating ancient trapped water isn’t as simple as checking a label. Researchers rely on a method involving noble gases, elements like helium, neon, and xenon that get trapped in water along with the surrounding rock.
Here’s a simplified version of how the process works:
- Locate the water. Researchers follow cracks and fractures deep underground, sometimes literally by smell, since the ancient brine has a distinct sulfuric odor.
- Extract a sample. Teams collect the fluid directly from fractures in the rock, often under difficult mining conditions.
- Analyze trapped gases. Noble gases like helium and xenon accumulate in the water over time at measurable rates, similar to how carbon dating works for organic material.
- Send samples for specialized testing. Because these measurements require extremely sensitive equipment, samples are often sent to specialized labs, in this case researchers worked with colleagues at the University of Oxford.
- Calculate residence time. By measuring how much of these gases have built up, scientists can estimate how long the water has been isolated from the surface.
The full process, from first extracting a sample to confirming its age, took years of testing.
What Does the Water Actually Look and Taste Like?
The ancient water isn’t clear, and it definitely isn’t drinkable. It’s roughly ten times saltier than seawater and has a thick, syrupy consistency. When exposed to oxygen, it changes color from clear to a faint orange, likely due to iron dissolved from the surrounding rock reacting with air.
Sherwood Lollar has described tasting the water directly, calling it bitter and noting its strong sulfuric smell. Scientists caution that drinking this kind of ancient brine isn’t something to try casually. Its unusual chemistry, including high salinity and low oxygen, could potentially overwhelm a person’s system if consumed in any real quantity.
Why Does This Discovery Matter?
It offers a window into ancient Earth chemistry
The chemical makeup of the water resembles conditions found around hydrothermal vents on the ocean floor today, environments some scientists consider strong candidates for where life on Earth may have originated. Studying water that’s been chemically isolated for two billion years gives researchers a rare, direct sample of a very different planetary environment.
It hints at how life might survive without sunlight
Researchers have found evidence of microbial life in some of these deep, ancient water pockets. Unlike surface organisms that depend on sunlight, these microbes appear to survive on limited chemical energy generated by reactions between water and rock, a process where hydrogen and sulfate compounds provide the energy that would otherwise come from photosynthesis.
It has implications for the search for life beyond Earth
NASA researchers have visited Kidd Creek specifically because environments like it can act as a stand-in for conditions that might exist underground on Mars or other planets and moons. If microbial life can survive for billions of years in isolated, sunless, mineral-rich water on Earth, similar mechanisms could theoretically support life in comparable underground environments elsewhere in the solar system.
Common Misconceptions
Misconception: This water is safe to drink or scientifically similar to normal groundwater. The water’s extreme salinity, sulfuric chemistry, and total isolation from surface systems make it fundamentally different from any water found in aquifers or wells used for human consumption.
Misconception: The two-billion-year figure is a precise, confirmed number. Scientists describe these ages as minimum residence time estimates based on gas accumulation, not exact measurements. The real age could be similar or potentially even older, and researchers continue refining their methods.
Misconception: This is definitely the oldest water anywhere on Earth. It’s the oldest water that has been dated and confirmed so far, but researchers say other deep, isolated water systems may exist elsewhere that simply haven’t been found or tested yet.
Misconception: The microbes found nearby prove ancient life existed in the water itself. Researchers have found evidence of microbial activity in some ancient water systems at the site, but confirming whether organisms have truly lived in isolation for the full residence time of the water, rather than migrating in more recently, remains an open area of research.
Key Facts
- The water was found at Kidd Creek Mine near Timmins, Ontario, the world’s deepest base-metal mine.
- Some water samples have a minimum estimated residence time of roughly 1.5 to 2 billion years.
- The mine’s rock formed around 2.7 billion years ago on what was once ancient ocean floor.
- The water is about ten times saltier than seawater and has a syrupy texture.
- Its chemistry resembles that of deep-sea hydrothermal vents, considered a possible environment for the origin of life.
- NASA has studied the site as a model for how life might survive underground on Mars.
FAQ
What is the oldest water ever found on Earth?
Water discovered at Kidd Creek Mine in Ontario, Canada, with an estimated minimum residence time of roughly two billion years, is currently considered the oldest known water on Earth.
How was the ancient water discovered?
Geochemist Barbara Sherwood Lollar and her team tracked fractures deep inside the mine, extracted fluid samples, and used noble gas analysis to estimate how long the water had been isolated from the surface.
Can you drink the ancient water?
No. It’s extremely salty, low in oxygen, and chemically unlike any water people normally consume. It isn’t intended or safe for drinking.
Does the water contain life?
Researchers have found evidence of microbial life in some deep, ancient water systems at the site, organisms that appear to survive on chemical energy from water-rock reactions rather than sunlight.
Why is this discovery important for space exploration?
Because the water and its surrounding chemistry resemble environments that might exist underground on Mars or other planetary bodies, studying it helps scientists understand how life could potentially survive in similarly isolated, sunless conditions elsewhere in the solar system.
Key Takeaways
- Water isolated for up to roughly two billion years was discovered nearly three kilometers underground at Kidd Creek Mine in Ontario.
- It’s the oldest confirmed water on Earth, dated using noble gas analysis.
- The water is extremely salty, sulfuric-smelling, and unlike any water found near the surface.
- Its chemistry resembles deep-sea hydrothermal vents, a leading candidate environment for the origin of life.
- The discovery has implications for understanding how life might survive in isolated underground environments on other planets.
Conclusion
The ancient water trapped deep inside Kidd Creek Mine offers a rare, direct sample of a world that existed long before plants, animals, or anything resembling familiar life had appeared on Earth. Beyond the record itself, the discovery continues to shape how scientists think about the chemistry that may have supported early life, and how similar processes might be happening right now in isolated, sunless environments elsewhere in the solar system.


Masgonzola: What It Is, Ingredients, Taste, Uses, and How It Differs From Gorgonzola

Neworldsmagazine: What It Is, Topics, Website, Content, and What Readers Should Know

Nidia del Carmen Ripoll Torrado: Biography, Family, Shakira Connection, and Life

Kane Brown: The Life and Career of Country Music’s Genre-Blending Star

Lionel Messi: Career, Records, and Where He Stands in 2026

Jason Beck: Detroit Tigers Beat Reporter and One of Baseball’s Most Trusted Voices
-
 Business3 months ago
Kane Brown: The Life and Career of Country Music’s Genre-Blending Star
-
 Sports3 months ago
Lionel Messi: Career, Records, and Where He Stands in 2026
-
 Lifestyle4 months ago
Jason Beck: Detroit Tigers Beat Reporter and One of Baseball’s Most Trusted Voices
-

 Sports3 months ago
Gordon Ramsay’s Brother: Everything Known About Ronnie Ramsay
-

 News3 months ago
NCIS: What the Show Is About, How It Works, and Why It’s Still On the Air
-

 News3 months ago
Amber Heard: Career, Legal History, and Where She Is Today
-

 News3 months ago
Trump Tariffs Explained: What They Are, How They Work, and What They Mean for Prices in 2026
-

 News3 months ago
Patrick Muldoon: The Life and Career of the Days of Our Lives and Starship Troopers Actor